Save 20% on all courses!



Chart Patterns
Chart patterns are formations on a price chart that help traders identify potential reversals, continuations and breakouts in the markets.
What is Chart Patterns?
Chart patterns are recurring price formations that help traders understand market direction. By learning to identify these patterns, you can spot potential trend reversals, continuations, and breakout opportunities with greater confidence.


Explained
Why Learn Chart Pattern
Follow the simple path to built your chart pattern skills
Chart Pattern Classification
Reversal Pattern


These pattern indicate that the current trend may reverse direction


Neutral Pattern
These pattern suggest that the existing trend is likely to continue in the same direction

Continuation Pattern
These pattern show indecision in the market and can break out in either direction.


High Probability setups
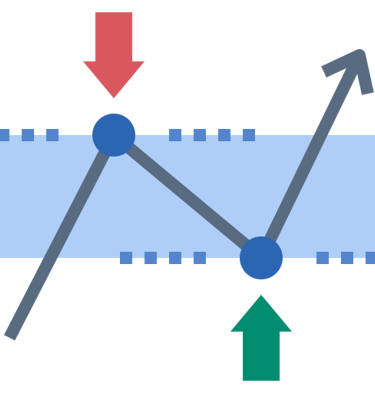
Identify high probability trading opportunity




Understand Market Structure
Improve Trading Performance
Read the market better and understand price structure.
Make consistent and informed trading decisions.
Better Risk Management
Plan trade according to stoploss, entry and target.


Identify Trend
Understand what BOS is, how it forms and how it confirms trend strength




Confirm Breakout
Retest Entry
Identify valid breakout, false breakouts and how to trade breakouts successfully
Understand strong and weak momentum, impulsive and corrective price moves
Spot Pattern
Learn CHOH and how it helps to identify potential trend reversal early

Risk Management
Use proper stoploss and manage risk.
How to Trade Chart Pattern
Help
Questions? Reach out anytime.
Contact
Subscribe
+91 6291073274
© 2025. All rights reserved.