Save 20% on all courses!

Swing Structure in Price Action: A Complete Beginner's Guide to Swing High and Swing Low
Learn what Swing Structure is in Price Action trading. Understand Swing High, Swing Low, Major and Minor Swings, and how traders use them to identify market trends.
7/15/20262 min read
Introduction
Swing Structure is one of the most important concepts in Price Action trading. Every financial market moves in a series of waves rather than a straight line. As price rises and falls, it forms important turning points that help traders understand the market's direction.
Before learning advanced Price Action concepts such as Break of Structure (BOS), Change of Character (CHOCH), or Smart Money Concepts (SMC), you should first understand Swing Structure. It provides a clear picture of market behaviour and helps traders identify trends, pullbacks, and possible continuation moves with greater confidence.What is Swing Structure?
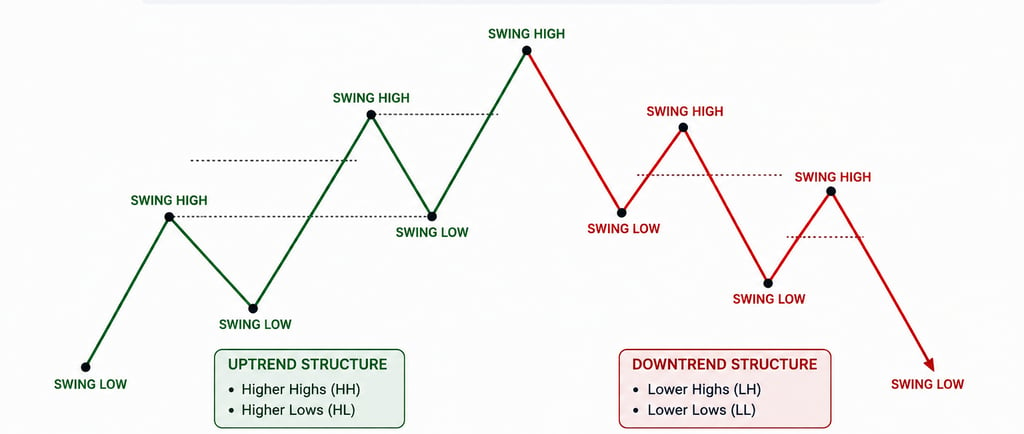
In the context of trading, swing structure refers to the way price moves within a specific time frame, creating a series of peaks and troughs. A swing high is the peak reached in a price rally before the price retreats, while a swing low is the lowest point reached before a price increases. Identifying these swings enables traders to gauge market sentiment and make informed decisions.
Major Swing vs. Minor Swing
Swing Structure refers to the natural wave-like movement of price on a chart. As buyers and sellers compete, the market creates a sequence of highs and lows. These turning points are known as Swing Highs and Swing Lows.
Rather than analysing every candlestick, Price Action traders focus on these significant swings to understand the bigger picture. Swing Structure removes much of the short-term market noise and allows traders to concentrate on meaningful price movements.
By recognising how swings are formed, traders can determine whether the market is trending upward, downward, or moving sideways.
Swing High and Swing Low
The swing structure is vital in price action trading because it provides insights into the overall market trend. By analyzing the sequence of swings, traders can determine whether the market is in an uptrend, downtrend, or ranging. This information enables traders to make decisions such as when to enter or exit trades, establish risk levels, and set target prices. For instance, if a trader notices a series of higher swing highs and higher swing lows, they may conclude that the market is bullish and consider entering long positions.
Practical Example
Imagine a stock rises from ₹100 to ₹120, creating a Swing High. The price then retraces to ₹112, forming a Swing Low, before moving higher again to ₹130 and creating another Swing High.
This sequence of higher swings shows that buyers remain in control. Although the market experiences temporary pullbacks, each correction is followed by a stronger upward move. A Price Action trader would view this as a healthy uptrend and look for buying opportunities near the Swing Low rather than chasing price at the top.
Common Mistakes
Many beginners make similar mistakes when learning Swing Structure:
Treating every small price movement as a Swing High or Swing Low.
Ignoring the overall market trend.
Confusing minor pullbacks with trend reversals.
Entering trades before a swing is fully confirmed.Focusing only on individual candles instead of the complete market structure.
Developing patience and learning to identify meaningful swings can greatly improve trading decisions.
Conclusion
Swing Structure is one of the core building blocks of Price Action trading. By understanding how Swing Highs and Swing Lows are formed, traders can read market trends more accurately and avoid making emotional trading decisions.
Mastering Swing Structure allows you to recognise trend continuation, identify healthy pullbacks, and prepare for advanced concepts such as Market Structure, Break of Structure (BOS), and Change of Character (CHOCH). Like any trading skill, it requires practice, but once understood, it becomes an essential part of analysing any financial chart.
Help
Questions? Reach out anytime.
Contact
Subscribe
+91 6291073274
© 2025. All rights reserved.